
When do l get the maps?
One of our values is transparency, and since many technicians, agronomists and farmers rely on us for monitorize their lands is our duty to explain the way we collect their data and create the maps that every week we present to our customers.
First of all we will explain what is the service we aim to provide to our customers. We are engaged on provide up to 52 images per year, that means one image per week, and up to means that the maximum number of images is 52 per year, why that? Because the weather can jeopardize the collection of the satellite data.
Our satellite image provider gives us an average of 5.5 images per week on every area almost around the hole globe.
Every Monday the semi-automated system checks the availability of images from on Saturday and Sunday, if some of those days an image serve all quality requirements is set for calculate the maps to provide to the user, if not on Tuesday the system checks if Monday has images available, if not Wednesday checks for Tuesday and until Friday.
We think that the best way to monitorize your lands is to organize the week at the beginning of it with an image of the day before, that’s why we aim to provide on Monday them maximum amount of images possible to help our clients, if not every day the system checks if a new image is available.
On the next lines we will present a case where clouds and shadows will stop our servers to provide you data. Those are the standards we follow in order to provide you the best image possible.
Possible scenarios every week
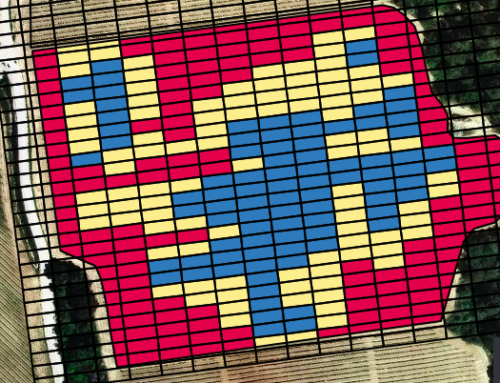
As you can see here this is an perfect image to provide for your land, the area we require for the server is the land the customer has provide on the system for monitorize weekly.
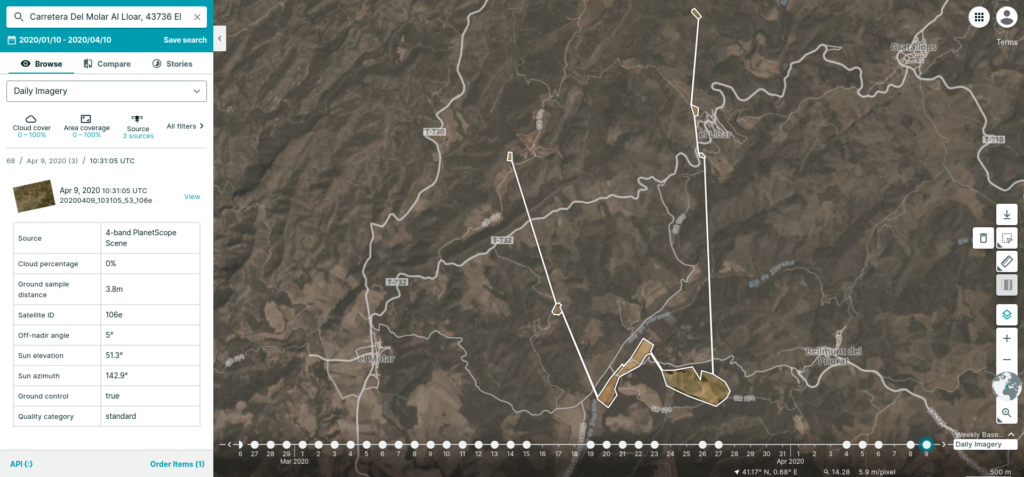
The cloud percentage you see on the left is 0 and the whole area looks perfect with the colors of the ground.
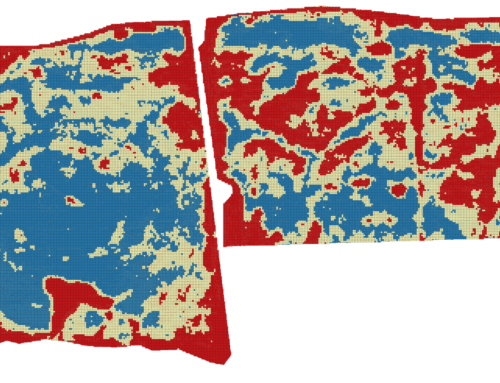
On this scenario you can see two days in a row of the area covered by clouds.
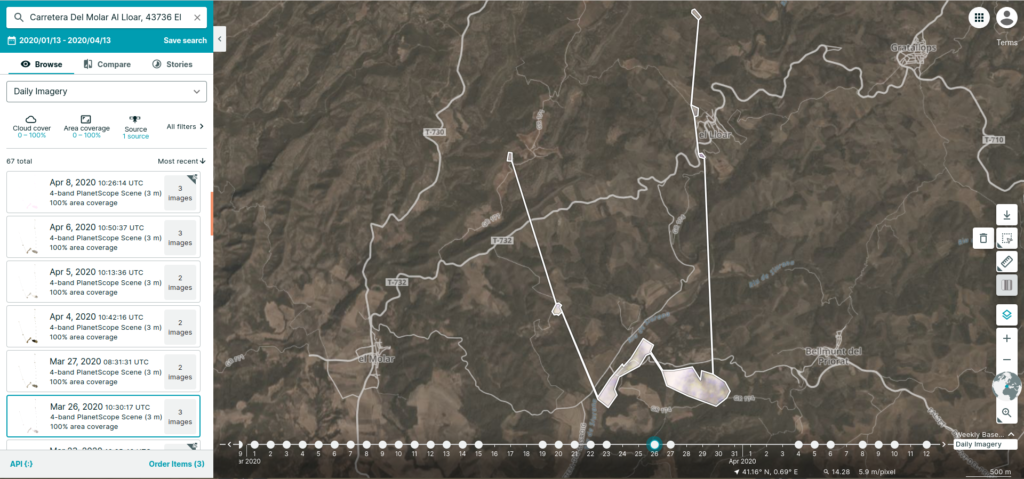
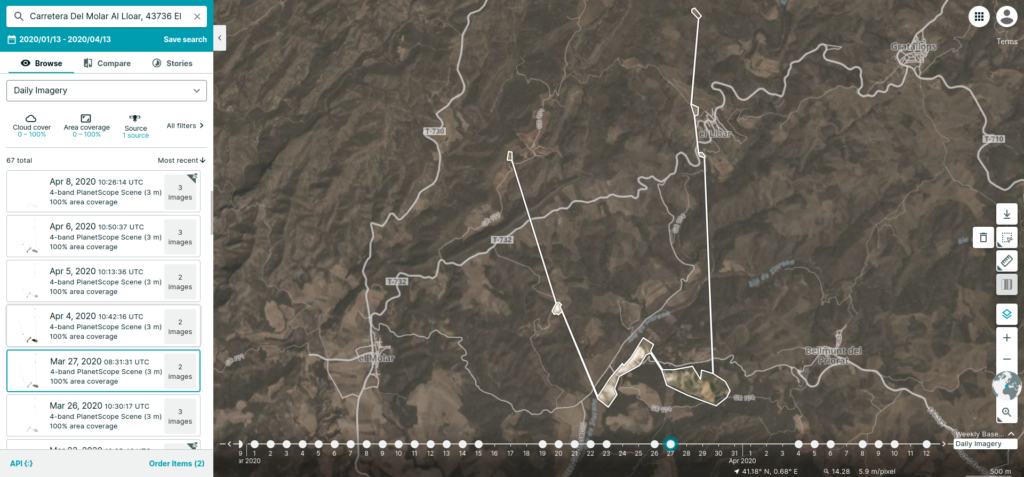
Those two days the image is discarted.
Special scenario
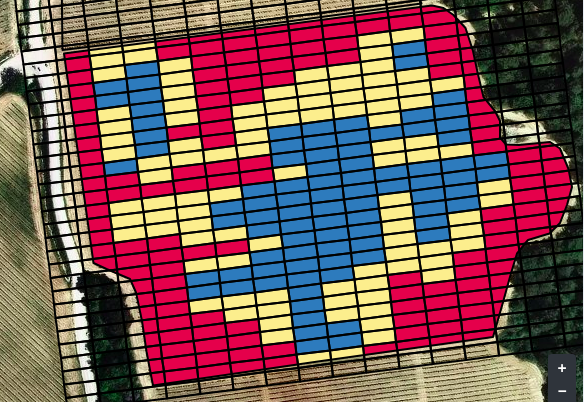
And here on the last image we see this:
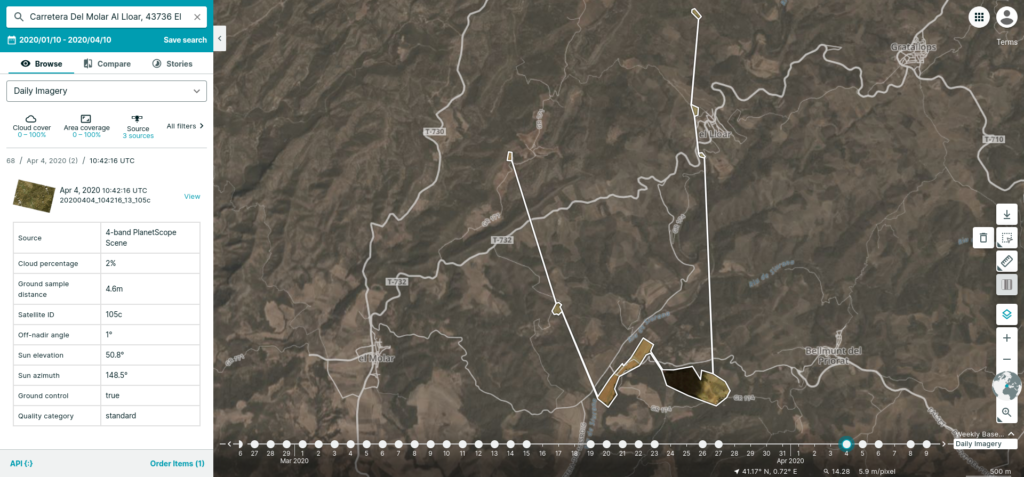
As you can see on the left the cloud percentage is 2% on the hole tile image, not the area of interest we have provided, but a black spot can be seen, that is caused by the shadow of a cloud, on the hole ares no clouds are noticed, and the client knows that the hole day has been sunny with very little clouds but on the moment the image was taken a shadow from a cloud is on the land.
This image is not used because it doesn’t serve our quality standards.
Here we will explain why we don’t use this images.
The real explation of why we don’t use those images
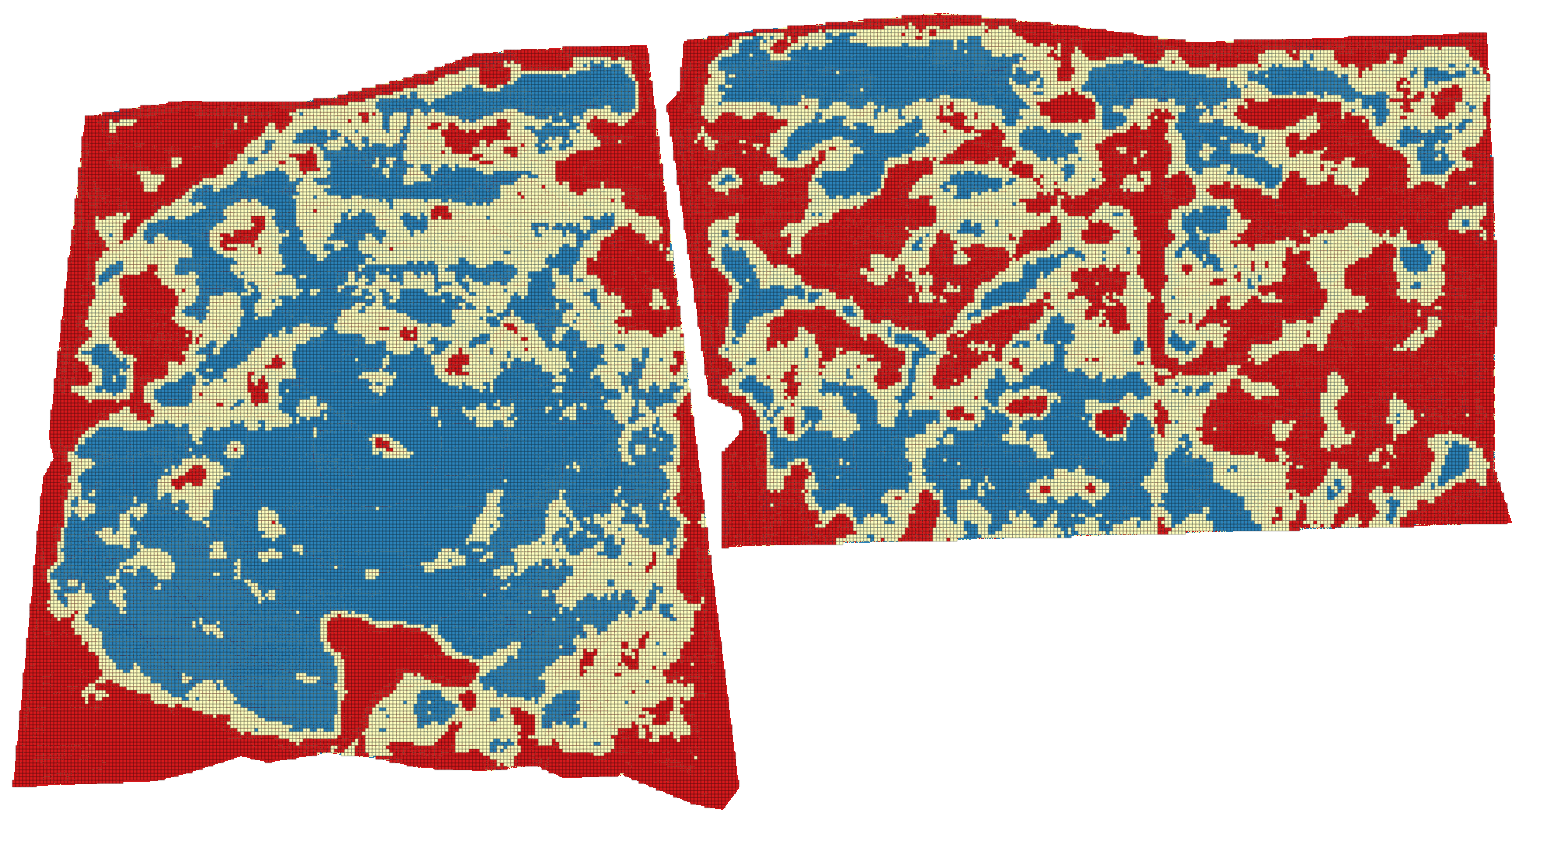
Probably you know already this information, but a our raster image is a collection of numbers of RGBN that with the proper calculations we get the values of the index on every pixel. A shadow is set on NIR Band as a 1, so it will indicate an increment of the Vigor on the the plant as you can see on this comparison
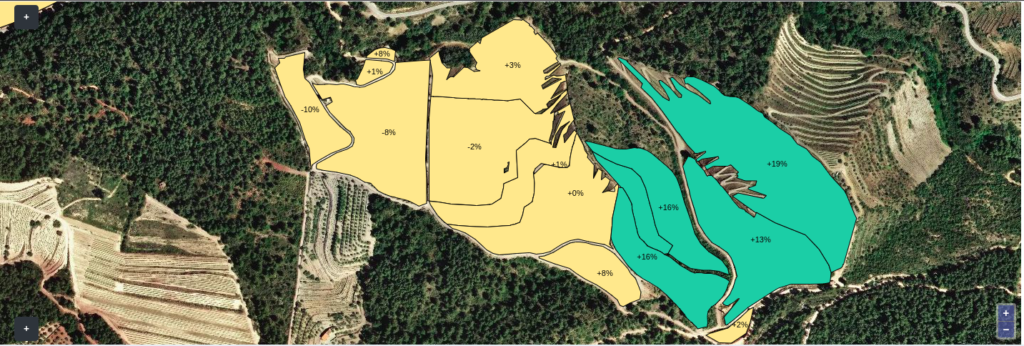
This is the difference between the images before presented, the one with the shadow an the one with perfect conditions, as you can see the are with the shadow reduces the Vigor between the shadow image and the perfect one, and the rest of the land behaves completely the opposite when the hole are should go the same way since the crops and variety is the same.
We hope we helped you to understand how our service works and how you should be expecting maps to arrive.
Don’t hesitate to contact us if you think something is not working properly, we will answer you to any doubt you have.
Regards from E-STRATOS team