
Variable rate maps creation guide.
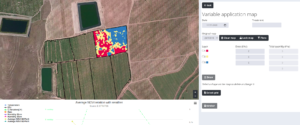
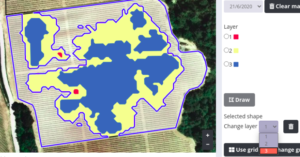
The new view of variable rate maps its build to integrate the information we get from the satellite to our machine controller.
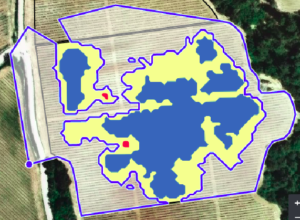
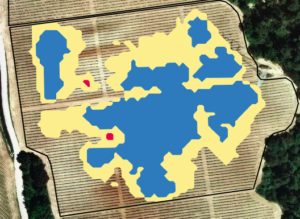
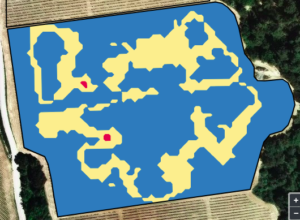
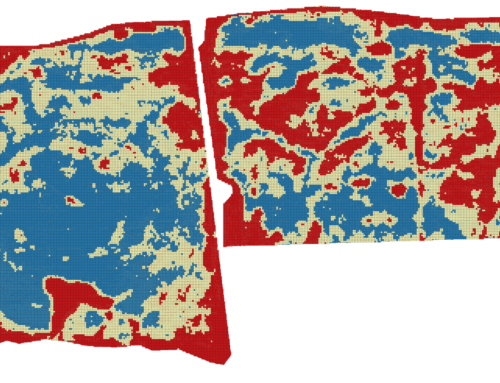
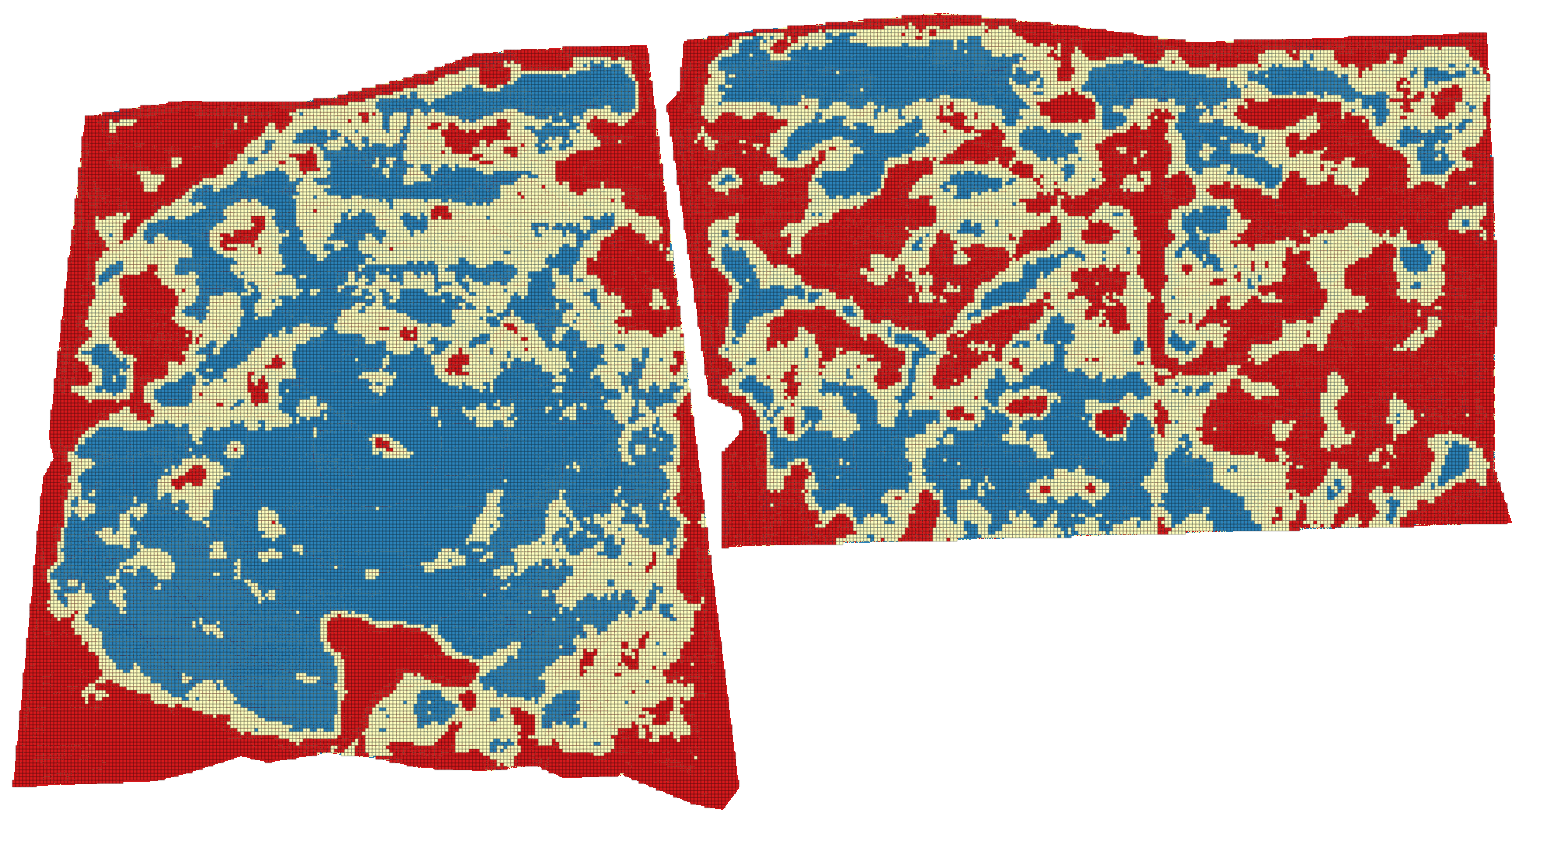
The map will show the plots, and in case of available images, the relative NDVI maps.
There could be two scenarios:
-
The land has relative NDVI images, then on each plot the color shapes will be prompted.
-
The land has no images, then just the perimeter are shown.
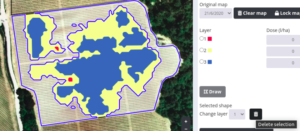
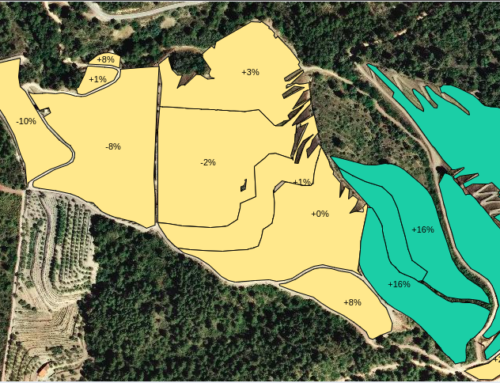
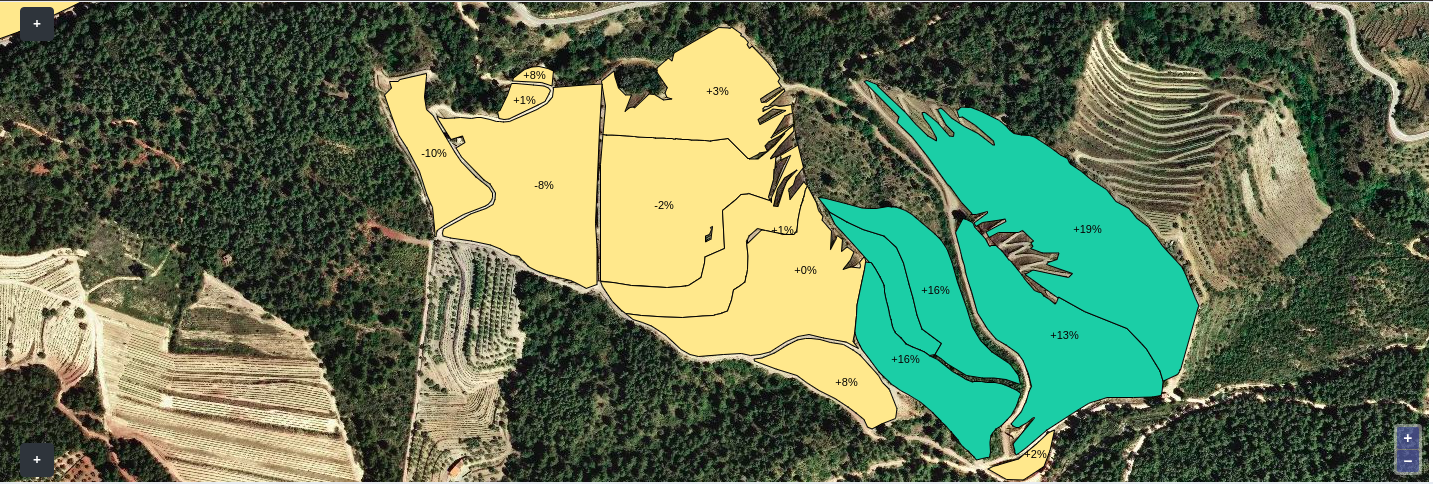
On the right side of the page there is a menu with all the options available.
At the bottom a table will all the previous variable rate maps created is available to download.
What to do with the menu?
-
Date: the date where the variable rate map is planned to be done, by defautls is today.
-
Treatment: the product that will be applied on the soil.
-
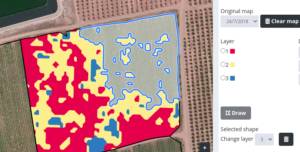
Original map: is the relative NDVI map that is used as a reference, all the historical satellite images are shown and able to choose.
-
Clear map: removes all the shapes on the actual map.
-
Lock map: it fixes the map to allow you to draw with a template.
-
Plots: shows all the plots on that land in order to choose the ones that will be used.
-
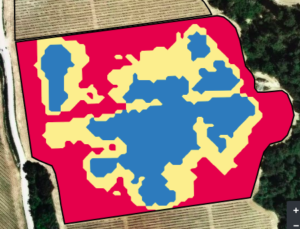
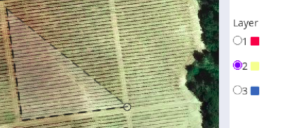
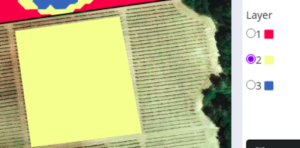
Layer: choose any layer in order to draw for the right level.
-
Dose: set the amount of product to be applied on each layer(liters each hectare).
-
Total quantity: it calculates automatically the quantity of product according each layer dose.
-
Draw: you can start drawing after select which layer needs to be modified or created.
-
Every time a shape is selected it can be changed to another layer or remove it.
-
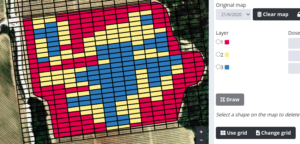
Select grid: allows upload a .geojson to set a as ground template. It has to be a collection of polygons, multipolygons are not allowed.
-
Use Grid: apply to the map the grid already uploaded, calculating which layer has higher presence on each rectangle and convert them to layers.
-
Change grid: replace the old grid with the new one.
-
Save: the variable rate map generated will be saved on the server if a treatment and the dose of each area are filled up.
-
Download: a .geojson file is available to save on your computer.
Interact with the map
-
Select a shape and modify the area.
- Select a shape and remove clicking the bin icon.
- Select a shape and change the layer.
- After select one layer the button of drawing will be available. The new shape can be also modified and removed.
We hope you like this new function. We well keep you informed of new updates.
Regards from team E-STRATOS.